
- If you are waiting for a market crash, you missed it.
- “Higher rates for longer” is ending – The Fed pivot. – Are we there yet?
________________________________
Congratulations! – You survived COVID-19, high inflation, busy airports during peak travel season and all other pesky inconveniences you may have endured lately. Despite what the news might suggest, the world is not ending yet.
There has never been a better time to be alive. I’m convinced that humanity’s better nature holds excellent prospects for the rest of the century.
When Is The Crash?
If you have been waiting for a real estate market crash, you could have blinked and missed it again. See if you can spot it here:
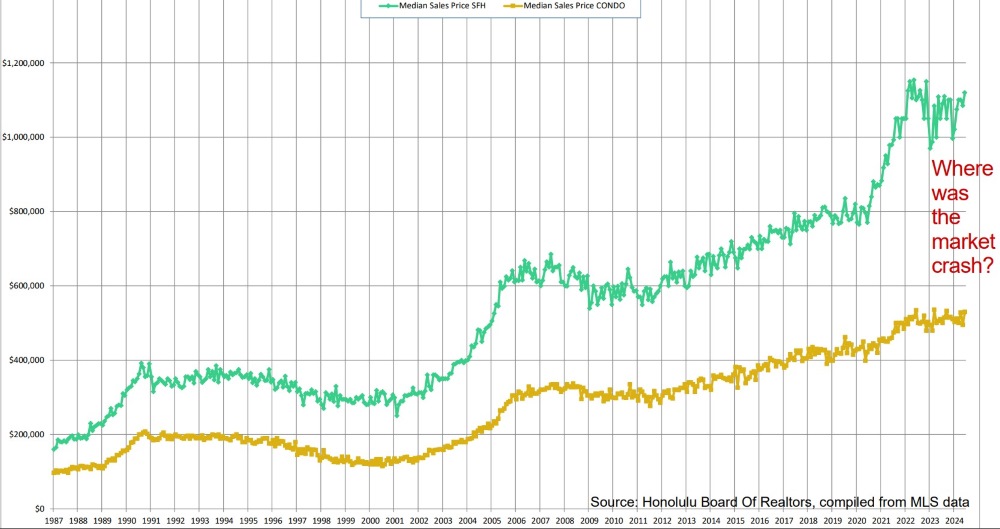
The crash came and went. January 2023. Oops, hindsight is 20/20, and market timing is futile. As always, ‘it’s time in the market, not timing the market.’
See related article: Wealth Creation With Real Estate
In March 2023, we shared that the recent drop in Oahu’s Median Sales Price from its Summer 2022 peak is likely the extent of a crash we will see. It bounced back since then and has morphed into a new plateau where prices meander sideways.
Mortgage Rates
In September 2023, we shared that interest rates could be near their peak. In October, 10-year treasuries peaked at 4.93% and have been gyrating between 4% and 4.5% since. 30-year Fixed Mortgage Rates peaked in October 2023 at close to 8% and are hovering below 7% as of this writing.
Here is a link to today’s mortgage rates.

Interest Rate Sensitivity vs. Inverse Correlation
No doubt, rate sensitivity slowed real estate demand. On average, properties stay on the market longer than before mortgage rates increased in 2022. However, median sales prices remain firm.
The reality of the market has again debunked the famous old myth: “When rates go up, prices must come down.” No measurable inverse correlation exists when you superimpose the median sales price graph over the mortgage rate graph.
2024 YTD Comparison
The first six months of 2024, compared with the first six months of the prior year, 2023, show:
- Oahu single-family homes are a) selling faster and b) more closed in 2024 than in 2023.
- Oahu condos are a) selling slower, and b) fewer closed in 2024 vs in 2023.
- Single-family home and condo median sales prices increased in 2024 vs 2023 and remain within 5% of the all-time median sales price peak set in 2022.
The relative slowdown in condo sales in 2024 vs 2023 could be due to the difficulty in getting financing earlier this year, as many condo buildings were underinsured for hurricane coverage.

See related article: The Market Is Up. Should I Sell My Hawaii Investment Property?
——————————–
Fed Policy Curbing Inflation: “Higher Rates For Longer”
Inflation remains a hot topic. For nearly a year, the Fed has held short-term rates at their highest levels in 23 years to push inflation down to its desired 2% target.
Federal Reserve Chair Jerome Powell acknowledged a cooling job market after government data from 7.5.2024 showed unemployment climbed to 4.1%, breaking its historic streak of 27 months under 4%.
That’s still historically low but up from 3.4% early last year. It marks the third straight month of rising unemployment, one of the critical indicators of a cooling economy and evidence that the Fed’s high-rate policy has been successful.
The Fed Pivot – Are We There Yet?
Regarding the central bank’s dual mandate of maintaining stable prices and maximum employment, Fed chair Jerome Powell told House lawmakers on 7.9.2024, “I think for a long time, we’ve had to focus heavily on the inflation mandate. But now we’re getting to where the labor market is getting pretty much in balance to where it needs to be.”
So far, Powell has been careful not to offer a timeline for interest-rate cuts. Based on the latest data, traders are now pricing in an 83% probability of rate cuts beginning with the Fed’s meeting on September 18, 2024.
Use this handy CME FedWatch Tool to monitor the probability changes by selecting “18 Sep 2024” on the top horizontal toggle bar.
The Fed’s projections for 2025 show a policy rate of 4.1% (currently, the policy rate remains at 5.25% to 5.5%). That means you might expect four more quarter-point cuts in 2025.
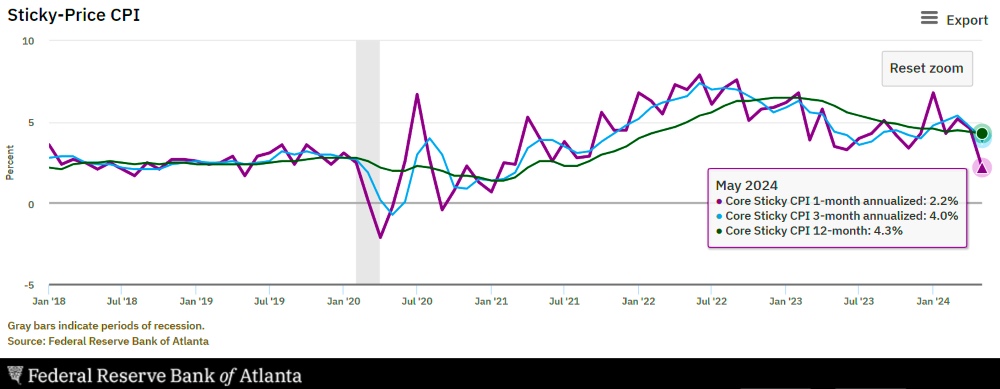
Monitor the latest core sticky CPI numbers here. The trend towards 2% continues. – We are getting there. Soon, but not yet.
What’s next?
Although the Fed controls short-term rates, the Fed’s actions change the long-term inflation outlook, affecting 10-year treasury yields and 30-year mortgage rates.
You may reasonably expect that mortgage rates will drift lower in the next 12 months, which could bring back increased demand for Honolulu real estate and the Oahu market.
——————————–
More Graphs To Entertain Curious Brains
Experts’ predictions are notoriously lousy, particularly about the future. But don’t take my word for it. I’m only right 50% of the time. That’s as effective as dart-throwing monkeys.
See related article: Let’s Check The Crystal Ball
We all desire to overcome uncertainty and discover what comes next. If you have read this far, you deserve a few of the following graphs.
May you succeed in overcoming your cognitive biases and make better decisions to create your optimal future.
Supply – Active Inventory

Although the supply of single-family homes and condos remains below pre-COVID levels, the condo supply has been increasing during the last six months. This could spell a further slowdown for the condo market. Don’t be surprised if trying to sell your condo takes longer.
Demand – Pending Sales

That slowdown for condos has been shaping up during the last couple of months of pending sales data.
Demand – Closed Sales

Eventually, pending sales will turn into closed sales 30 to 60 days later. YTD Closed Sales are higher by 6.8% for single-family homes and 5.8% lower for condos, compared with the same six months last year.
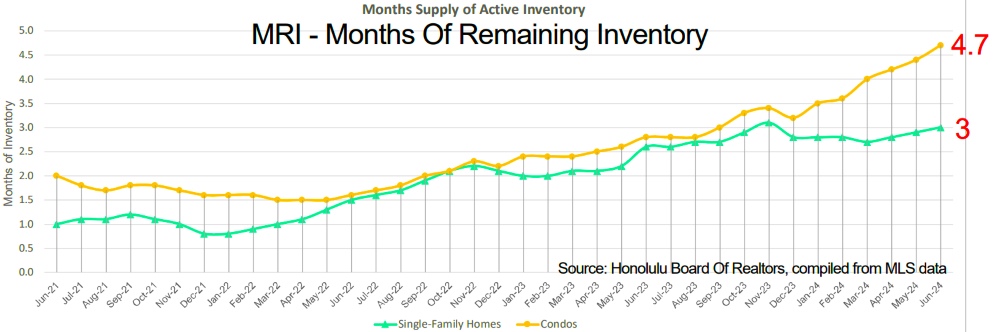
MRI – Months Of Remaining Inventory
MRI combines supply and demand into one ratio. MRI is the current active listings divided by the monthly closed sales rate. MRI shows us how fast the existing inventory sells. Or, how many months would it take to sell the current active inventory at the current monthly sales rate?
The lower the MRI, the faster the existing inventory sells. When MRI is trending up, then the market is slowing down.
MRI hit a multi-decade record low at the start of 2022 and has been increasing through 2023 and 2024 YTD.
MRI is at 3.0 for single-family homes and 4.7 for condos. That is still below 5.0, historically considered the mid-range benchmark for a balanced market.
Although MRI has been moving up, interest rates will eventually ease, which could bring back increased demand.
——————————–
Increased Uncertainty? – Excusitis?
Someone explained that, due to increased uncertainty, they want to wait until after the November elections to make real estate decisions. – Really?
Over the last 200,000 years of human history, uncertainty has steadily decreased.
One of the two running top-presidential contenders will most likely win the election. For now, it is too early to tell which one. Make sure you vote.
I hear this election excuse every four years. It’s a form of excusitis, the failure disease caused by the inflammation of the excuse glands, in which one blames external circumstances for one’s shortcomings and indecisiveness.
Stop waiting for things to happen. Instead, make things happen.
Get on with life and focus on the best course of action today that is within your control. Everything else is noise.
Can you identify on the following graph when elections had any measurable impact on real estate values?

Check this source for the latest updates: S&P CoreLogic Case-Shiller U.S. National Home Price Index (CSUSHPINSA) | FRED | St. Louis Fed (stlouisfed.org)
——————————–
Final Thought
Unless you live with your parents, you rent or buy. Renting offers the flexibility of moving with short notice. But if you are committed to living in Hawaii, buying might be the better long-term option.
When you rent, you pay off your landlord’s home with little to show. When you buy, you pay off your own home and build equity.
Waiting for lower prices and trying to time the market is a fool’s game.
Instead, consider that the best time to buy is when you are ready to commit to living in the same neighborhood, and you find a suitable home you can afford.
Choose, visualize, and design your desired outcome. Then, take the most practical, feasible, and necessary action toward making it come true. Manufacture your luck by positively influencing the areas of your life that are within your control.
——————————–
— We don’t just write about this stuff. We are expert realtors representing buyers and sellers of real estate in any market condition. We are committed to providing the most excellent service available on the planet. We love what we do and look forward to assisting you too!
Contact us when you are serious and ready. We are here to help.
——————————–
Also…, we want to make this The Best real estate website you’ll visit. We’d love to get your feedback on how we might improve. We are humbled by your support and remain committed to constant learning and growing with you. ~ Mahalo & Aloha
Hi George,
Thanks again for the update. Interstate reading.
In regards to the condo market do you think that the following may have had an impact on the pricing of condos in the market:
1. Continued government interference in the rental market regarding regulation of rental periods and licensing costs;
2. I’ve read some stories about condo buildings facing various problems with regard to increasing costs for building master insurance policies or possible cancellation as a result of failure to undertake certain maintenance or repairs. While this may only affect certain buildings now as the age of buildings increase this may impact more and more of them in the future.
3. Increase in holding costs for condos especially increasing monthly fees combined with the possibility of additional assessments as a result of point number 2 above and the impact of inflation on the costs of maintaining and running the condo.
I read in another article your comments about the level of monthly condo fees, but looking at the general level of these fees for condos in Hawaii could give some people a heart attack. That being said there is a huge range of costs for this item between buildings.
These have really soared over time and IMO reflect the huge increase in costs in Hawaii. The monthly maintenance fees for the condo we used to rent is now more than what we used to to rent it for a month. In fact those fees are five times what they were when we rented the condo for our holidays in Waikiki.
(The price of the condo after including the cost of conversion to fee simple is only up less than 100% over that time period….)