Paul Brewbaker with TZ Economics is one of the sharpest and most respected economist here in Hawaii. His analysis on Hawaii economics and Oahu real estate is candid and insightful.
Summarized below are a few key takeaway points from his presentation during the 6/8/2016 HBR regional meeting in Honolulu. These are subjective notes we took during the presentation with particular focus on Paul’s current Oahu real estate market outlook. But before we get started, let me share a little story from 16 years ago:
I first met Paul in 2000 during one of his presentations in front of about 300 top realtors at the Hilton Hawaiian Village. Paul predicted with unshakable confidence that the median sales price for Oahu single family homes could reach $676,000 by the year 2007. In 2000 this seemed unbelievable and bold, especially in front of a large number of realtors. At that time the median Oahu single family home value had been hovering around $300,000 for several years.
Prior to Paul’s 2000 presentation the Oahu real estate market experienced a prolonged softness throughout all of the 1990s. This softness was in part because of Japan’s real estate bubble bursting in 1990, starting what has become known as Japan’s ‘lost decade’. Japanese real estate investors had been a strong buying force during the late 1980s but became net sellers through all of the 1990s.
Take a look at the following historical graph (courtesy HBR, compiled from MLS data) showing Oahu median sales prices:
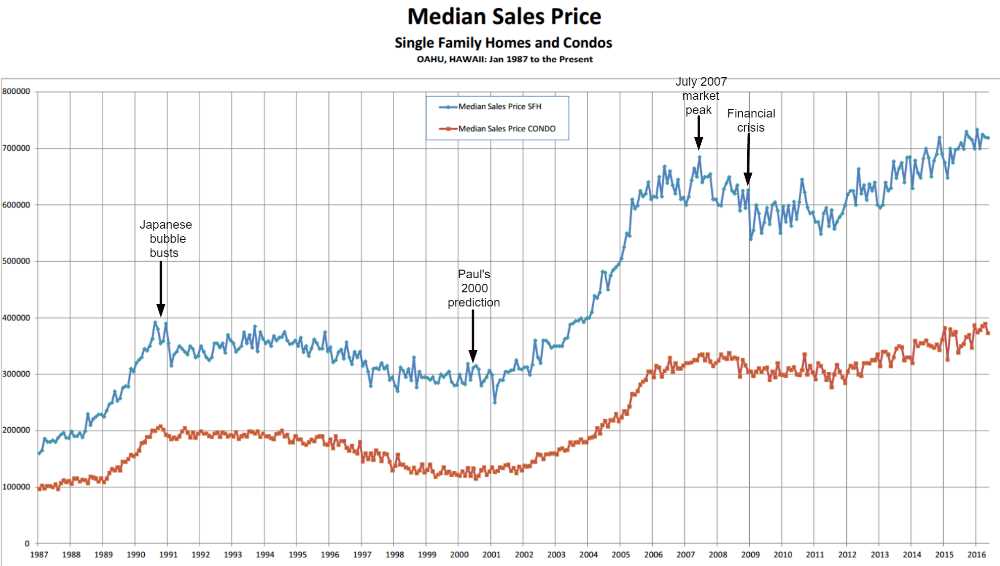
During 2004 and 2005 it became clear that Paul’s ambitious prediction from 2000 could very well come true. In the Summer of 2007 the median sales price for Oahu single family homes surpassed the predicted market value establishing a new market peak.
We greatly appreciate Paul’s presentations and pay close attention to his predictions. Following are some bullet point notes from Paul’s recent June 8, 2016 presentation. All graphs courtesy Paul Brewbaker – TZ Economics:
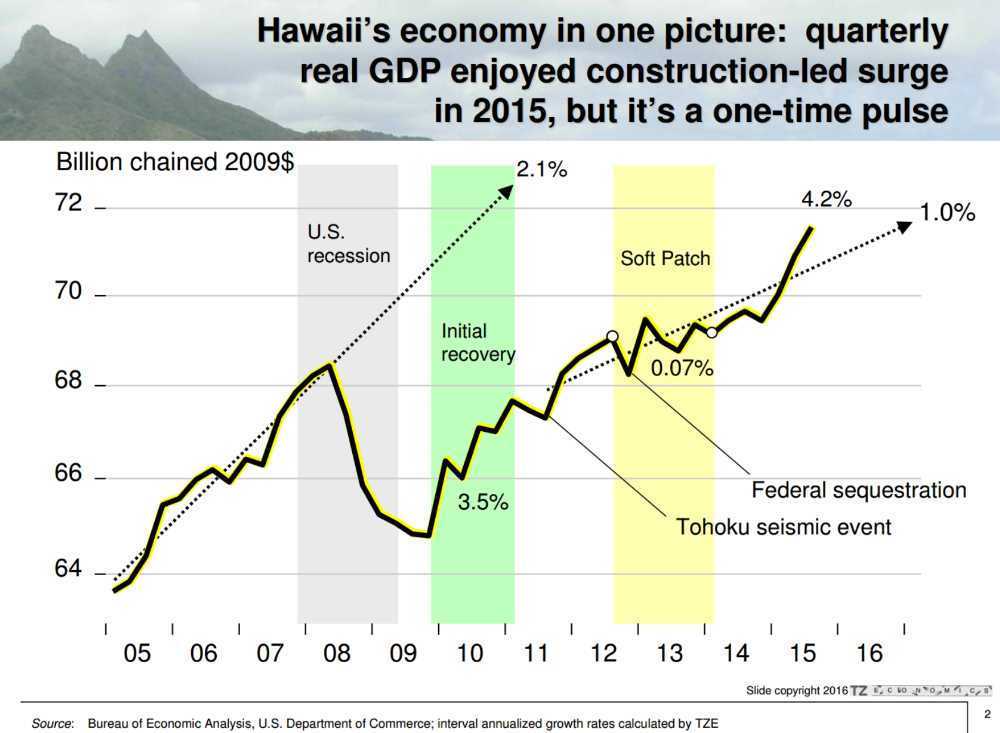
- Construction led Hawaii GDP quarterly 4% growth surge in 2015 is a construction led one-time pulse. Real Hawaii GDP growth is about 1%.
- Btw, 1% population growth with only 1% GDP growth translates into 0% net growth in production output per capita.
- After Ala Moana Shopping Center is being rebuild with another million sq ft of retail space being added, and after the International Market Place is completed (completion expected shortly), what is next?
- Think about out it: There is no new office building being built. The last Honolulu office building was built about 20 years ago – First Hawaiian Center in Downtown Honolulu.
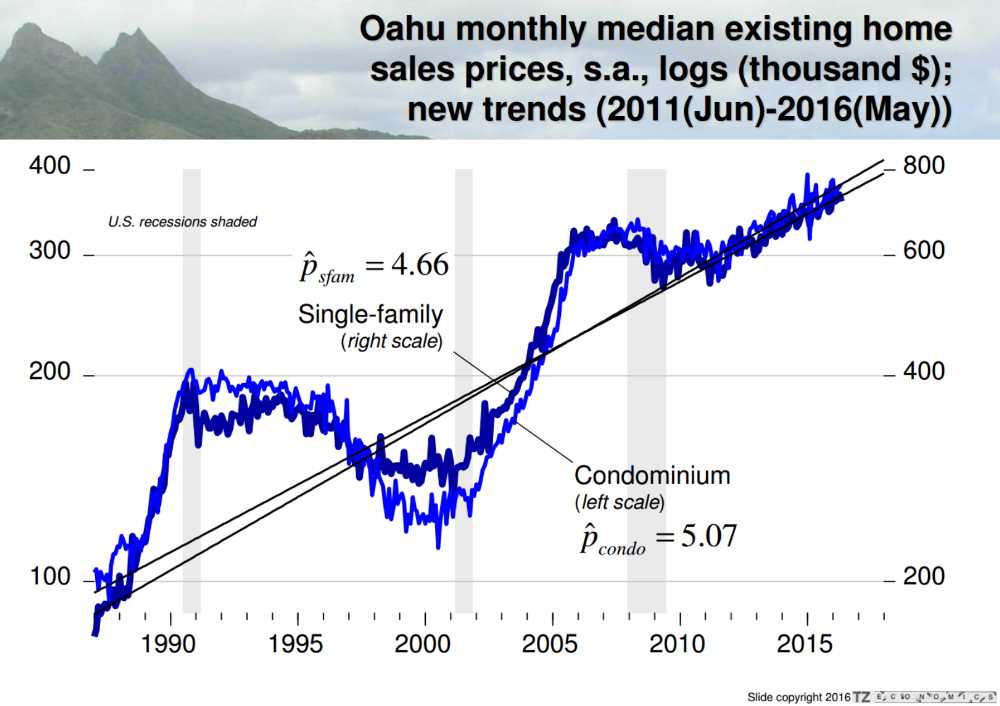
- Nice steady path coming? June 2011 to May 2016 translates into 4.7% (4.5% to 5%) price appreciation. Federal Reserve Board’s 2% inflation target means real estate appreciation actually is at 2-2.5% inflation adjusted.
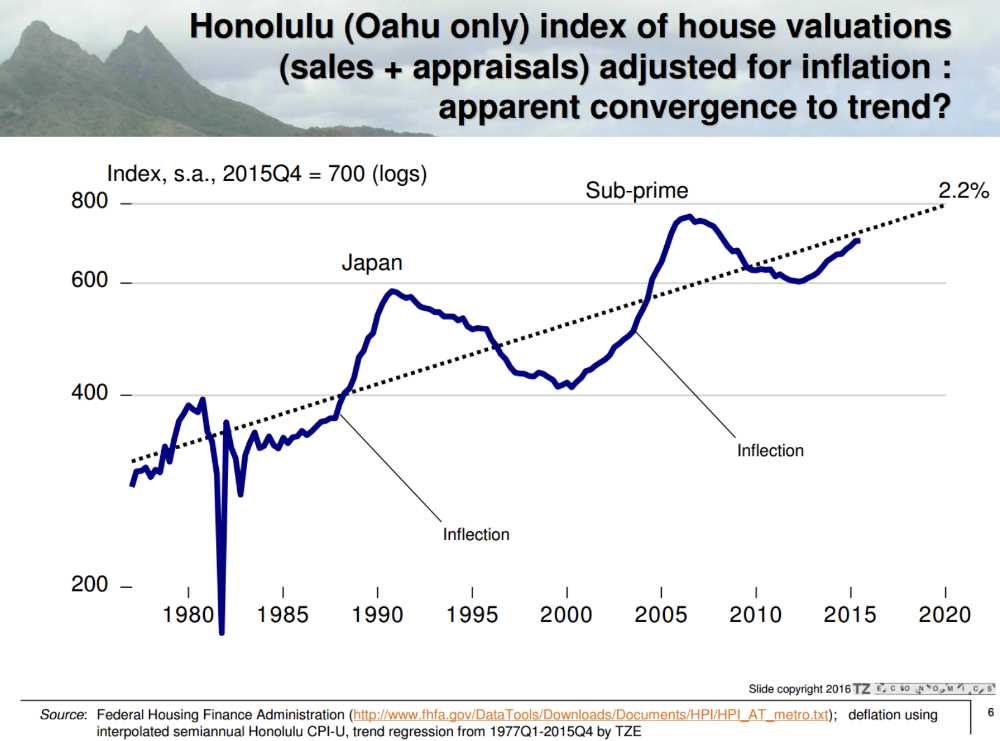
- The long term inflation adjusted home price appreciation trend for Oahu is about 2.2 % (~2.1% for all of Hawaii). Since Summer 2011 the current trend has been converging with the long term trend. Maybe the bubblish cycle swings are over for now.
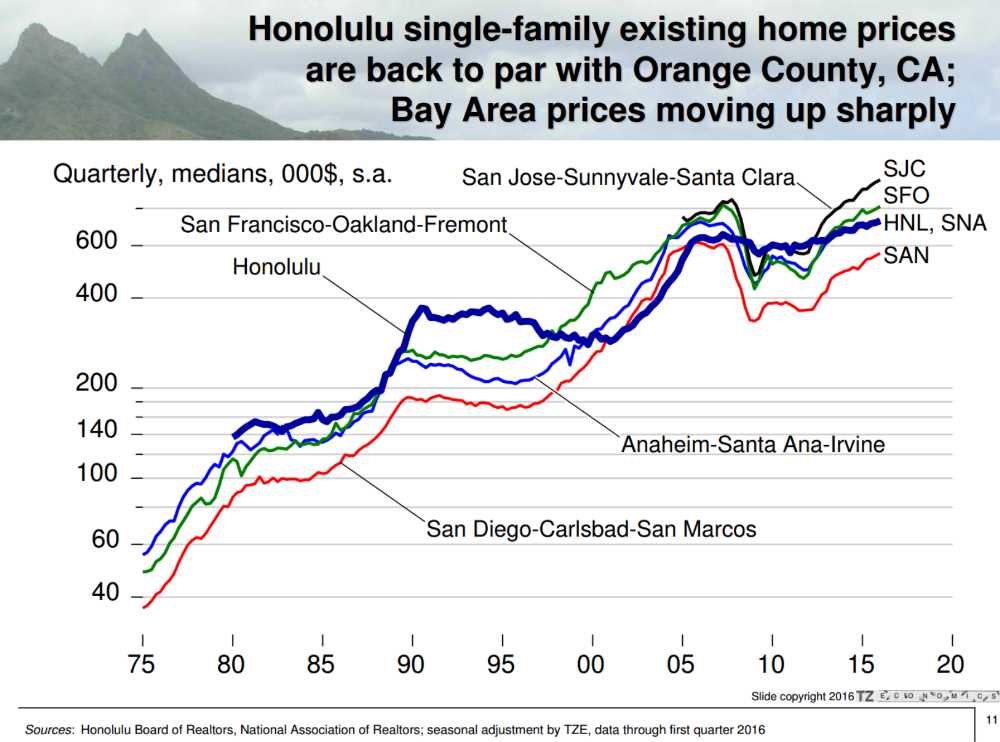
- California real estate prices are pulling away! If Honolulu continues to fall behind San Francisco and San Jose prices, than the arbitrage argument could be Honolulu in comparison will soon become undervalued.
- There is no bubble here. When your Uber driver is telling you to buy a condo, then you know we are in a bubble.
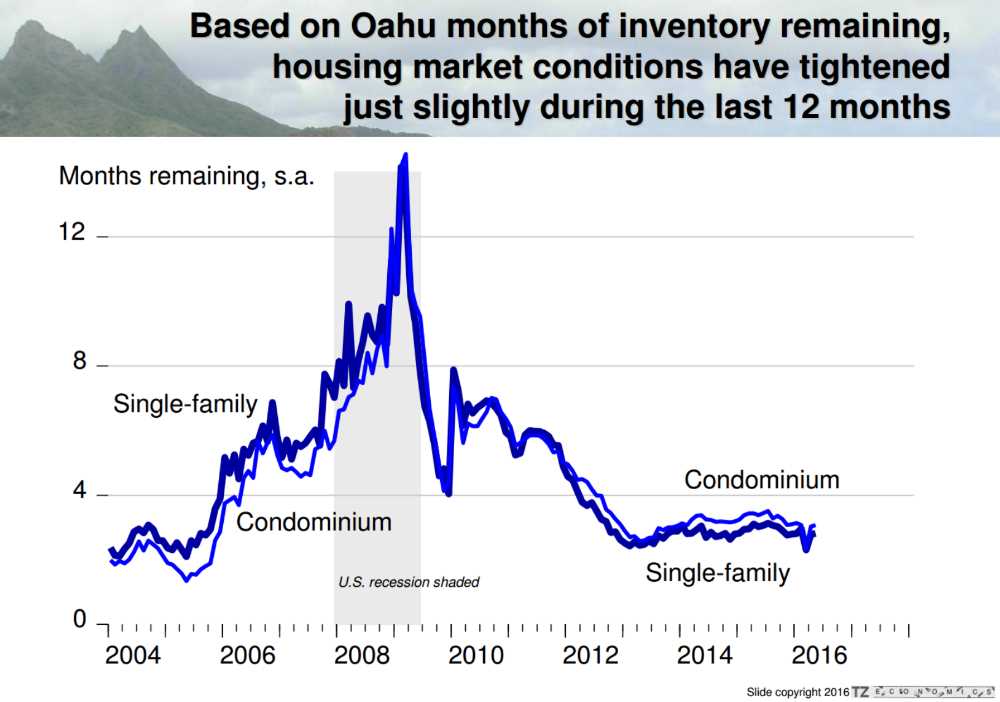
- Home sales volume (unit sales momentum) is slower and more sustainable. There are currently only 3 months of remaining inventory.
- DBEDT data 2012 through 2015 shows 87% of all Oahu real estate purchases were done by local buyers. Neighbor island local buyer ratio is about 60%.
- According to A&B, the Waihonua condo project completed in 2015 closed with about 70-80% local buyers.
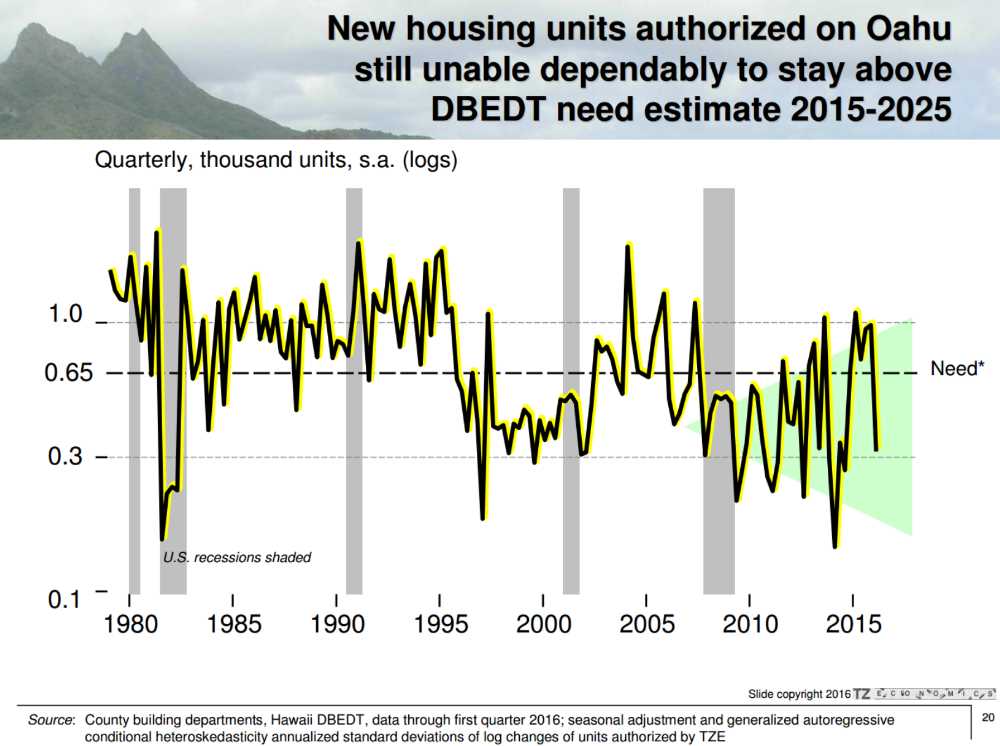
- Housing unit construction numbers have been consistently short of what is required in order to not have your kids live with you in the future.
- All Oahu single family homes above $1Mill have gone from 20% to 30% distribution from 2011 to 2015. All Oahu condos above $1Mill have gone from 1.5% to 2.5% distribution from 2011 to 2015. – This is a hidden tax increase with more and more properties falling into the 2014 established higher property tax rate Residential ‘A’.
- Conclusion: Looks like we are in a Goldilocks housing market. Steady, not too hot and not too cold without the big swings. 4.5% Oahu home appreciation equals about 2.5% real inflation adjusted Oahu home price appreciation and is expected to continue for the foreseeable future.
++++++++++++++++++++++++++++++++++++++++++++++++++++++++++++++++++++++++++++++
Let us know what you think. How do you see Hawaii’s real estate market and the general economy?
We like to hear from you.
~Mahalo & Aloha

Looks Good!!!
Aloha Ciro, Thanks for checking in. We will post a new Oahu real estate market update shortly. Check back soon. ~ Mahalo and Aloha