— An epic battle is raging between massive unemployment and Q-Infinity while the sneaky coronavirus is still trying to do us in. – Are we doomed?
Six months ago, the economy looked fabulous and real estate values were rock-solid. – What happened since? Where are we going from here?
Here we explore why the Hawaii real estate market behaves the way it does.
Oahu Real Estate 2020 Year To Date
We compare 2020 YTD, January through June, with the same six months, January through June of the last year 2019. Six months of data provide a sufficient sample size to spot any meaningful new trend.
Comparing only one month of data over another makes for sensational newspaper headlines, but it does little to spot a trend. Zooming out, the bigger picture reveals that monthly comparisons merely show short-term distortions based on insufficient data.
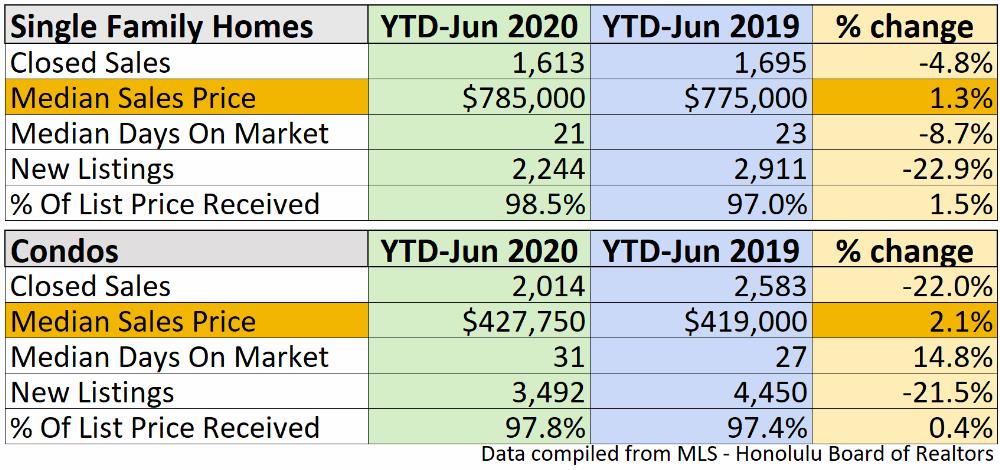
The Oahu Median Sales Price went up by 1.3% (Single Family Homes) and 2.1% (Condos) during 2020 YTD compared with the same six months last year.
How could this be when unemployment is skyrocketing?
See related article: Market update – Jan 2020
You will become an expert on the Hawaii real estate market when we explore the underlying factors. The following nine graphs (data though May 2020) are courtesy of Paul Brewbaker with TZ economics from a 6.17.2020 presentation for the Honolulu Board Of Realtors.
Supply
Supply is defined as how many homes and condos are available for sale at any time.
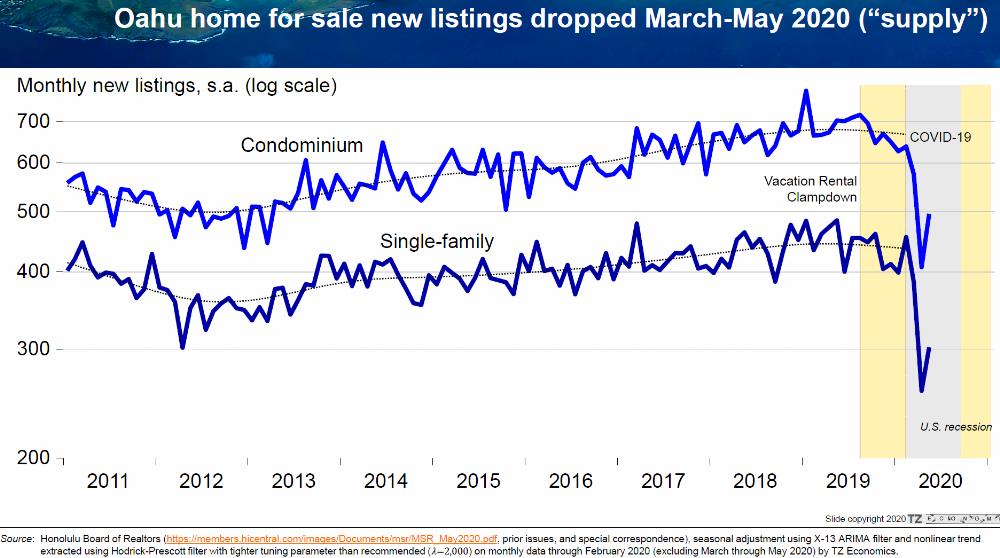
Supply dropped in March and April of 2020 and has been rebounding since.
Demand
Demand is defined by how many home and condo purchases are closing at any time.
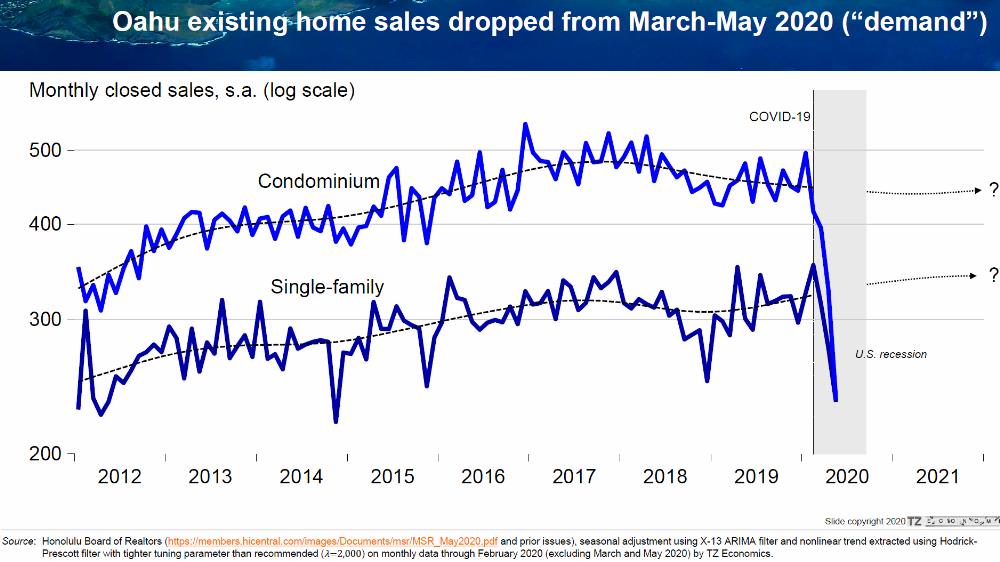
Demand dropped in March and April of 2020 and has also been rebounding since. However, it is not yet visible in this graph. A typical real estate purchase might take between 30 to 60 days to close from the purchase contract acceptance date. A change in economic conditions might affect the number of closed sales only about a month or more delayed.
Oahu Median Sales Price
A shift in the supply and demand ratio typically foreshadows a change in prices. When supply drops, prices might rise. And when demand drops, prices might fall.
We have seen about an equal drop in both supply and demand during the first couple of months of the COVID-19 crisis.
There has been little change in the median sales price.
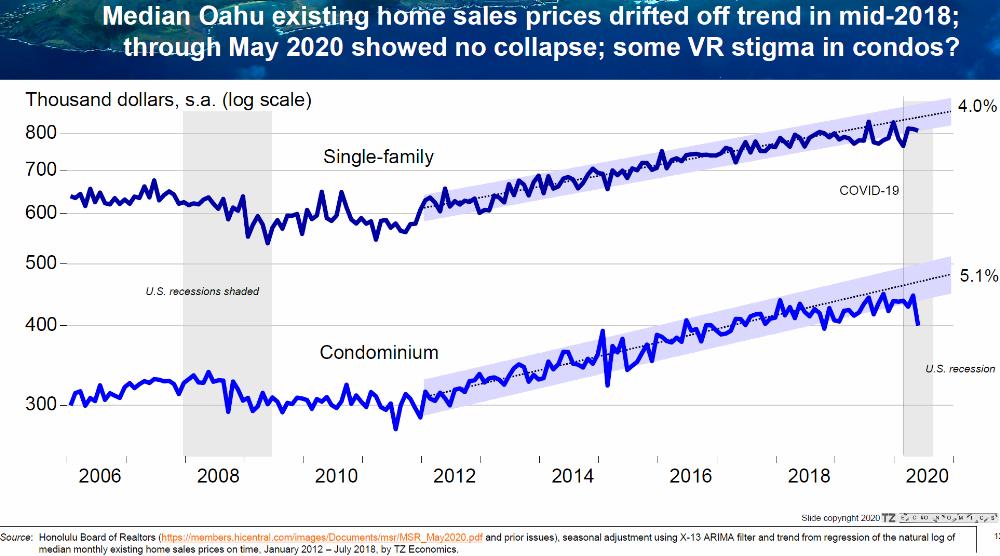
The drop in both, supply and demand created a new equilibrium between buyers and sellers, without much variation in the median sales price (graph through May 2020). Scroll down to see more graphs through June 2020.
Drastic stock market swings with spikes in volatility earlier this year did not translate into the housing market. Stocks have a high trading frequency due to $0 transaction costs and online ease of instant execution with a computer or smartphone.
Real estate valuations are slower to respond to shock events. Housing has longer ownership time frames and less frequency in trading compared to stocks. It takes prep time to list a house, marketing time to get it into escrow, and an additional 30-60 days to close the sale.
Since 1985, Oahu’s median sales prices have been higher year-over-year roughly 70% of the time.
That means that historically any given year Oahu’s median sales price tends to be at the top of the range compared to all prior years. This can be a troubling realization for anybody wanting to buy: “I don’t want to buy when prices are at the peak.”
But that’s the nature of all up-trending graphs. The most recent data point tends to be closest to the top. In fact, all previous buyers had to contend with the fear of buying close to the top at that time. It’s always been that way.
See related article: How To Buy Hawaii Real Estate When The Market Is So Expensive
Looking For The Bubble?
Without looking at additional reference data, buyers wonder again: “Is this a bubble where exuberant market behavior drove up asset prices unwarranted by the fundamentals?”
Or, are current valuations just a function of the normal supply and demand forces consistent with the long-term uptrend? Let’s dig deeper to get a better picture.
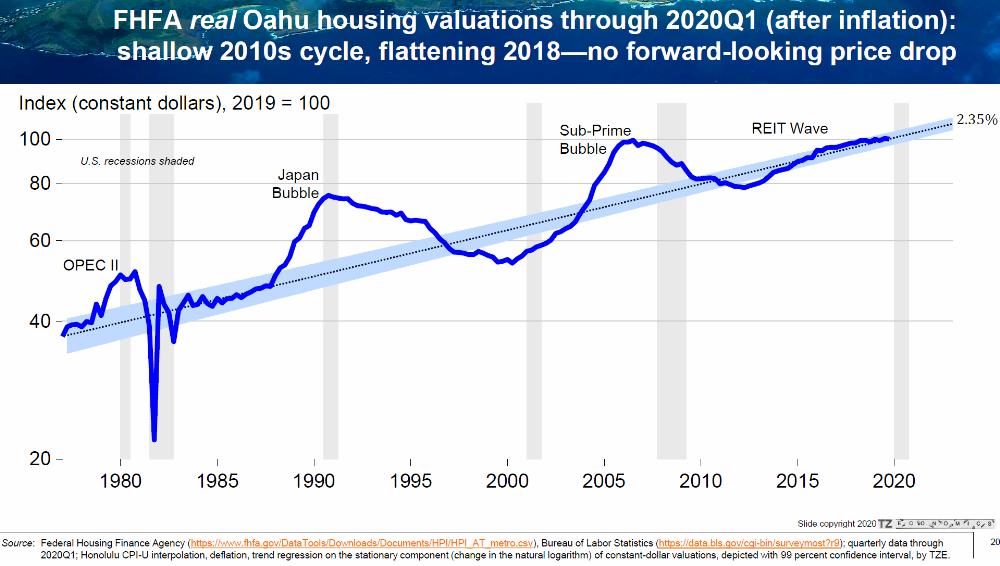
At times the market can overshoot or underperform the long-term trend. ‘Regression to the mean’ is a statistical term when extremely higher data points (bubbles) or lower data points compared to the long-term trend (mean) tend to eventually gravitate back closer to the mean.
The graph shows three bubbles peaking in 1980, 1990, and 2007 where valuations temporarily deviated above the long-term trend before regressing to the mean.
No signs of a pricing bubble since 2010.
The Fed structures its monetary policy to achieve a 2% benchmark inflation goal. Real inflation has been running just below 2% for years. Inflation might continue below 2% in the future despite the massive stimulus.
The nominal appreciation rate (before inflation) for Oahu real estate has been on average 4.5% per year. 4.5% nominal appreciation minus <2% inflation translates into Oahu’s long-term median sales price real appreciation rate at about 2.35% above the rate of inflation.
According to Paul Brewbaker: “The potential for real returns on capital might run slightly lower during the 2020s compared to before. That could also curb housing appreciation rates.”
Months Of Remaining Inventory (MRI)
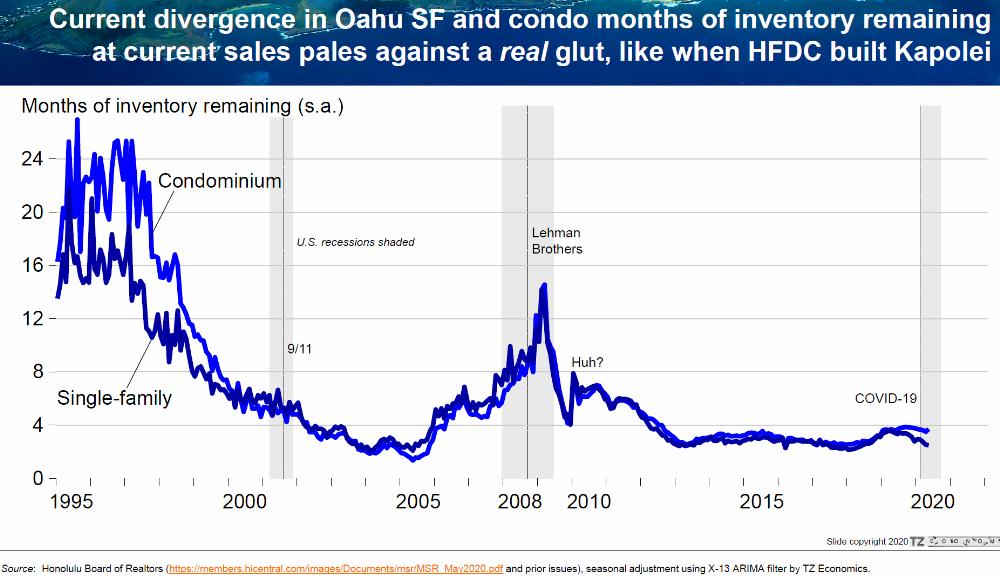
Another way to look at the market is by analyzing the Months Of Remaining Inventory or MRI. That’s the current number of active listings divided by the monthly closed sales rate.
- Example: Let’s assume there are currently 10 active listings available in a given neighborhood or condo project. Let’s say there were 12 closed sales during the last 6 months. That’s 2 closed sales per month on average during the last 6 months. 10 active listings divided by 2 closed sales/mo = 5 MRI
If the market were to continue at the same rate of 2 closed sales per month, then it would take 5 months to deplete the current active inventory.
MRI combines both supply and demand into one number. The higher the MRI number, the more of an oversupply is slowing down the market, which could lead to softer prices. In the past, MRI of about 5-6 has been generally considered balanced between a buyer’s and a seller’s market.
By comparing the MRI over time we can spot any trend reversals.
- When MRI is trending higher and above 5-6, then the market is tilting towards a buyer’s market. – Plenty of supply with few buyers.
- When MRI is trending lower and below 5-6, then the market is tilting towards a seller’s market. – Low supply with many buyers.
Since 2012, MRI has been remarkably steady around 4. – There is no sign of a bubble here.
New Housing Construction
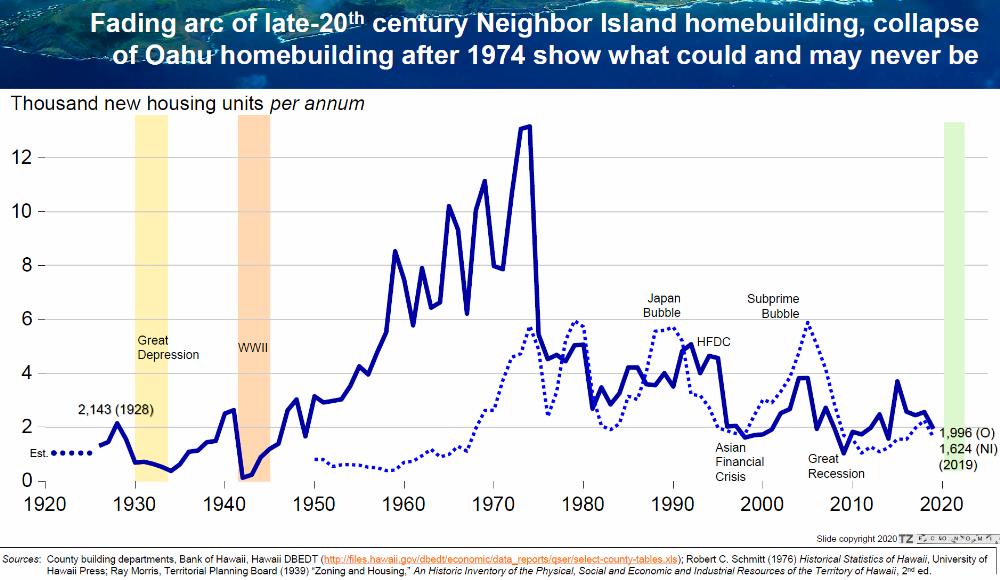
Hawaii is not Las Vegas. There has been little overbuilding on Oahu since 1974. – No home building bubble here.
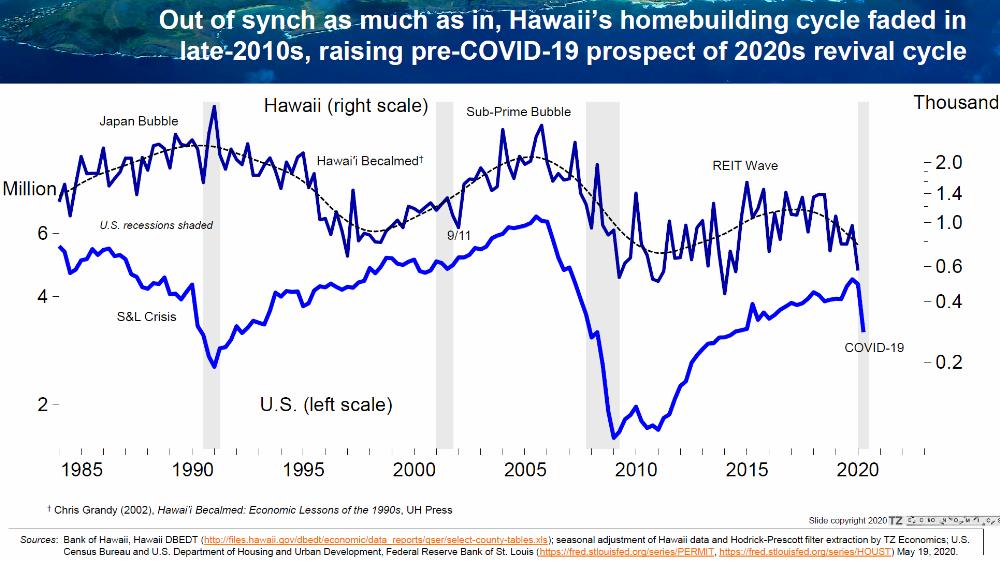
Hawaii’s home building cycle compared with the US mainland shows no bubble here.
Could there be a future glut of inventory with some of the new condo developments? Hardly so. The new construction projects amount to a drop in the bucket. And if the market were to slow down, then some of the proposed developments could simply be delayed or canceled.
See related article: New Honolulu Condo Building Boom?
Arbitrage
Last week I received a call from a San Jose homeowner who is currently selling his house. He felt that “San Jose home prices might be overextended and are about to collapse.” He is considering moving to Hawaii! – How does the San Jose market compare to Oahu?
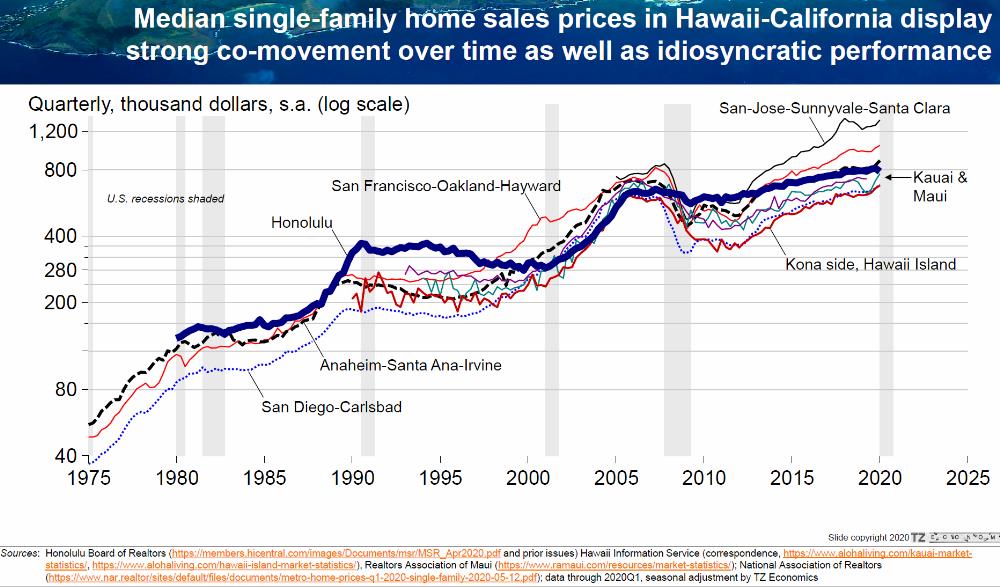
Zooming in, Honolulu’s real estate price appreciation lagged during the last 8 years compared to several other markets.
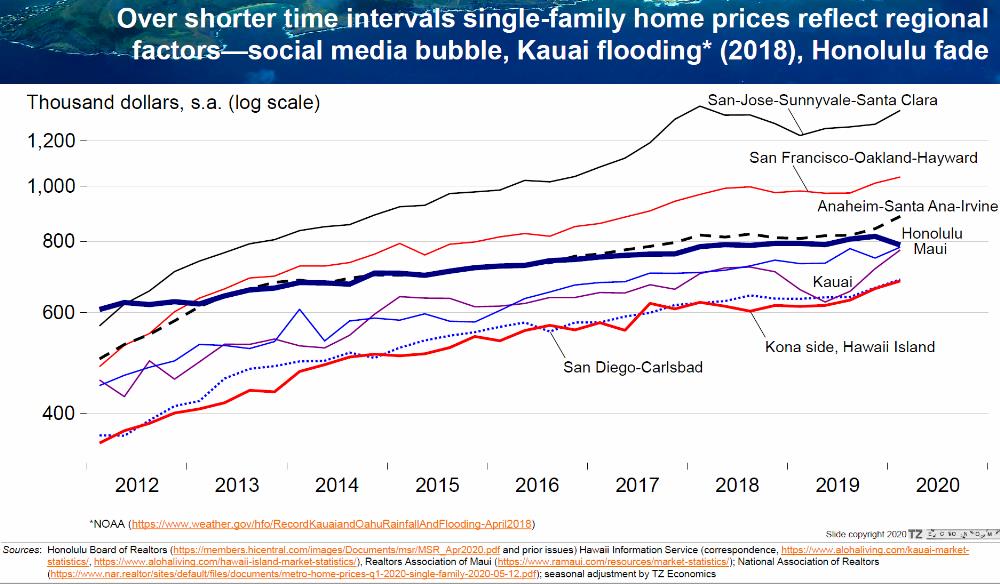
No bubble here. – Might we expect to see more San Jose money buying in Hawaii?
Capital is global. Due to arbitrage, more of it will find its way to paradise and recognize Honolulu as relatively affordable. If you can afford to live anywhere in the world, might as well pick Honolulu, especially during a pandemic.
Compare real estate prices with Paris, London, New York, San Francisco, Zurich, Hong Kong, Singapore, South Korea, and Japan. – Honolulu real estate still looks like a bargain.
See related article: What I Learned About HI Real Estate While Vacationing In Paris
What The Future Brings
I regret, we don’t have a crystal ball. Nobody does. We already discussed how experts are notoriously lousy in predicting the future. That’s true for modeling the pandemic, the economy, financial markets, interest rates, unemployment, the price of oil, the price of gold, Tesla’s future, commodity prices, picking winning stocks, election results, and real estate markets.
We can only:
- look at today’s facts, and
- try to extrapolate from past patterns, which will
- result in an opinion or speculation, or simply ‘guesswork.’
We present the facts as they become available. But today’s facts are merely the product of the past, a reflection of where we have been up until now. And extrapolating from past patterns becomes impossible when we experience circumstances never previously encountered.
See related article: COVID-19 – Hawaii Real Estate
“The levels of output and employment remain far below their pre-pandemic levels, and significant uncertainty remains about the timing and strength of the recovery.” ~ Jerome Powell 6.16.2020

Here are some random thoughts to ponder over.
- The timeframe for the pandemic recovery is unknown. – Will there be future waves and additional lockdowns? When will we have a safe vaccine available to all?
- The trajectory of new job creation is unknown. – What other economic ripple effects might affect the future outcome?
- The massive Q-Infinity stimulus package is supposed to keep the economy afloat and recovering. – What could be some unintended consequences that might materialize?
- Political posturing has become silly across the board resulting in unnecessary polarization and some unfortunate decisions on multiple levels. – How soon will common sense and scientific evidence be reconsidered as prevailing guides?
Let us know the answers and we’ll tell you Oahu’s median sales price for the next 12 months. There are too many variables that play together. Even the best experts are scratching their heads. We leave it up to you to decide where the market might go from here. But before you do, there is more:
Other Factors To Consider
There are many reasons why people move, e.g. job opportunities, affordability, lifestyle, and proximity to family/friends. Here is how the future balance between supply and demand could shift the market:
1) Job opportunities and affordability. Hawaii tourism has evaporated, leaving many without a job and little relief in sight. Relative affordability is a function of financial strength and staying power. Without a job, some could soon be looking for greener pastures on the mainland with prospects for a faster economic recovery.
—> Better job opportunities in more affordable mainland markets could lead to some selling in Hawaii and an increase in inventory.
2) Temporary eviction and foreclosure moratoriums help tenants and landlords that suffer from financial hardship due to COVID-19. Banks have speedily offered generous mortgage deferment and forbearance agreements. This is part of the massive stimulus program to minimize bankruptcies and foreclosures. Eventually, these programs will expire and the sugar pill wears off. Will consumers be able to swim once the floaties are taken away?
—> When Hawaii residents are unable to recover then inventory could increase.
3) Tourism activity affects short-term rental income. Short-term rental income affects net cash flow for vacation rental properties. Net cash flow affects the desirability and feasibility of investment properties. Diminished net cash flow potential could translate into less demand and more supply.
—> That could lead to lower valuations for investment properties, condotels, and vacation homes.
4) The Luxury Market is driven by desirability and location rather than by cost. Trophy properties come with bragging rights and the super-wealthy are less susceptible to economic shocks. Real estate is tangible and considered a safe haven in an uncertain investment world.
—> Demand from the super-wealthy can come back quickly which could move the high-end market.
5) Hawaii is paradise. The safest place on earth with quality of life and the finest weather on the planet. The appeal for making Hawaii your home has not diminished. Hawaii is the healthiest state in the nation with low COVID cases, no social unrest, riots, and looting.
Buyers from large cities re-evaluate life quality and purpose, and move to the cleanest environment available. This is similar to what we experienced after the 9/11 attack. Some retire while others choose to work remotely from Hawaii.
—> More lifestyle buyers increases demand which could drive the market higher.
6) New virtual 3D tour technology has enabled buyers to purchase without visiting. During the economic shut-down, our firm represented 11 buyers that bought their home without ever flying to Hawaii. Technology simplifies the purchasing process and diminishes the acquisition costs.
—> This goes together with #4) and #5) and could lead to increased demand.
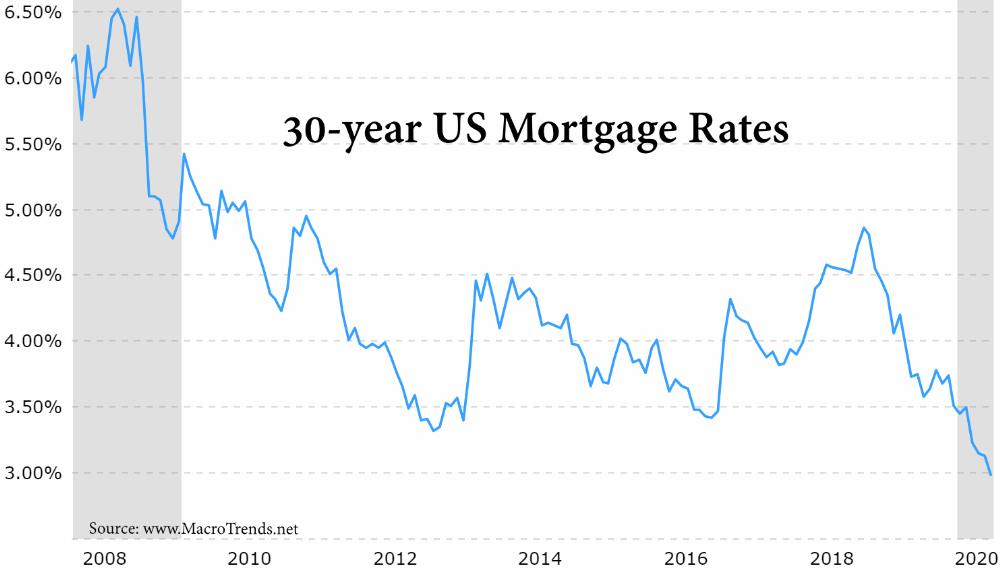
7) Interest Rates are at all-time bargain levels. There has never been a better time to lock in a 30-year fixed-rate mortgage. Interest rates dropped from 3.51% in January to an unbelievable low 2.98% in July. The drop represents a 6.5% increase in purchasing power and huge savings over the length of the loan.
—> This is likely to increase demand for the foreseeable future and keep market valuations robust.
_________________
Conclusion
There are dozens of factors that could tug the market one way or the other. However, there is no housing bubble. Supply has been low and demand remains solid except for short-term vacation rentals.
Here are the most recent graphs through June 30, 2020:
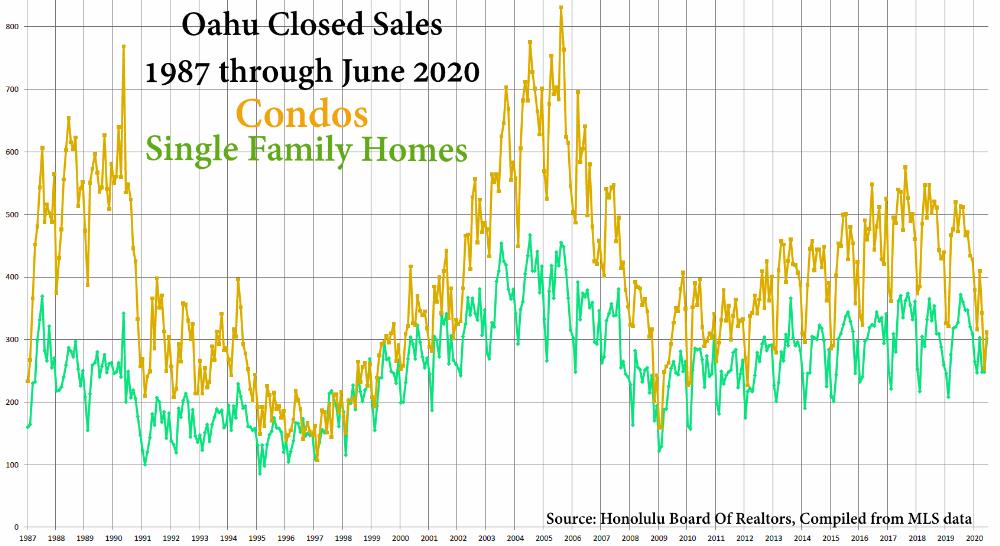
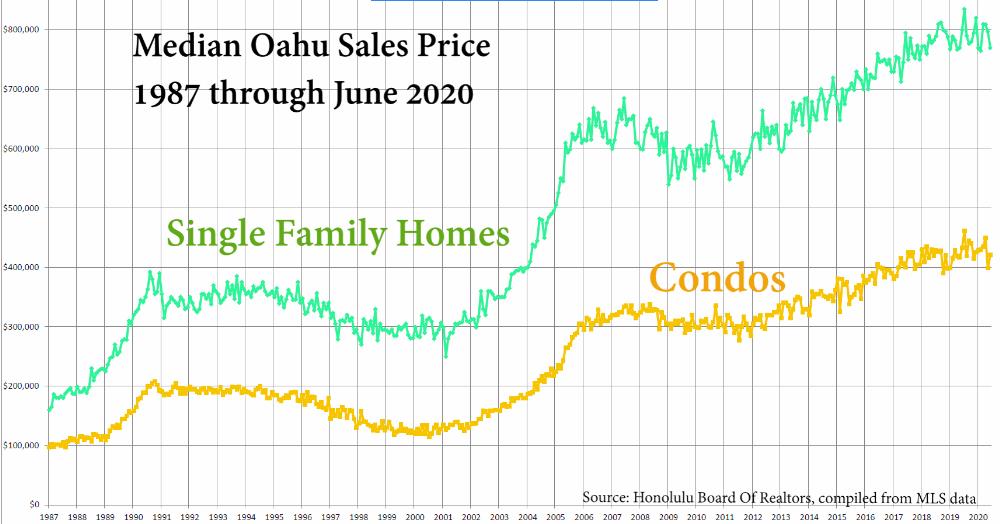
We don’t predict pandemics, economics, interest rates, politics, or the weather. Instead, we give you the data and tools so that you may draw your own conclusions.
One Final Thought
Unless you live with your parents, you either rent, or you buy. Renting offers the flexibility of moving with short notice. But if you are committed to living in Hawaii, buying might be the better long-term option.
When you rent, you pay off your landlord’s home with little to show for. When you buy, you pay off your own home and build equity. Waiting for lower prices and trying to time the market is a fool’s game.
Instead, consider that the best time to buy is when:
- you are ready to commit to living in the same neighborhood, and
- you found a suitable home that you can afford.
May you choose, design, and visualize your desired outcome. Then take the most practical, feasible, and necessary action towards making it come true.
Manufacture your luck by positively influencing the areas of your life that are under your control.
Wear a face mask, wear a seat belt, and look left-right-left before crossing the street. Stay safe and pursue your dreams.
________________
We don’t just write about this stuff. We are expert realtors specializing in representing buyers and sellers of real estate in any market condition. Contact us when you are ready. We are here to help.
~ Mahalo & Aloha
